
Enable Observability with OpenTelemetry
In the context of a distribute system, observability is key to reveal how services works alone but also how they collaborate each other as a system. This is done by propagating contextual information across the services such as request id, correlation id and user context.
Observability is where OpenTelemetry shines, in this post we will see what OpenTelemetry is and why you should look at it.
What is Open Telemetry?
OpenTelemetry (aka OTEL) became the de-facto standard to enable observability in modern systems. Open Telemetry is a CNCF project that provides a framework (APIs, libraries, SDKs and components) to instrument, collect and manage Metrics, Tracing and Logs.
Why choose Open Telemetry?
- Standardization means maturity, big community of contributors, larger amount of integrations, shared roadmap.
- Monitoring vendors are standardizing around OTEL. This allow to integrate your application traces, metrics and logs with multiple observability tools like Jaeger, DataDog, Zipkin, Application Insights without changing a line in your code. In other words you are decoupling the way to instrument from the visualization tools.
- Correlation of signals. Logs provide detailed information about application events and activities, while traces show the flow of requests across various services. Correlation adds context to logs by associating them with specific traces, enabling you to understand the exact context in which events occurred. A richer context leads to effective monitoring allowing operations teams to respond more accurately and efficiently to incidents.
Key components
What are the key components?
- OTEL client. SDKs and libraries that can be used to instrument your application. There are SDKs for different development languages (Java, .NET, Go, Ruby and more..)
- OLTP protocol. OTEL uses a tool-agnostic protocol called OTLP (OpenTelemetry Protocol) to send and receive the collected telemetry data.
- OTEL collector. The collector can be configured to use three type of components (Receivers, Processors and Exporters) to define the telemetry collection pipeline that fits your use case. The receivers ingest the telemetry data by supporting multiple formats (OTLP, Jaeker, Zipking, Prometheus,…). The processor might apply data aggregation, transformation, sampling, filtering, etc.. Finally the different exporters can be used to translate the telemetry data to a specific format used by the destination monitoring system.

Here an example of the YAML file to configure the OTEL collector with 3 different pipelines for metrics, logs and traces.
Data collection
The OpenTelemetry (OTEL) Collector can be deployed in various ways: close to the services, on the hosts, centralized, or in a mix of these approaches. Regardless of how your telemetry signals are collected (via SDK, Agent, or sidecar), one of the most common practices is to propagate traces, metrics, and logs to a centralized OTEL Collector. This approach offers benefits such as decoupling, enhanced manageability, and aggregation. Ensuring the Collector is highly available and can scale according to traffic demands is essential.
Multiple exporters and processors can be configured on the edge (e.g. when you are instrumenting your code) to implement various functions, including sampling. This approach allows you to perform data preprocessing, enrichment, and routing before sending the data to collector (or to the downstream observability tool).
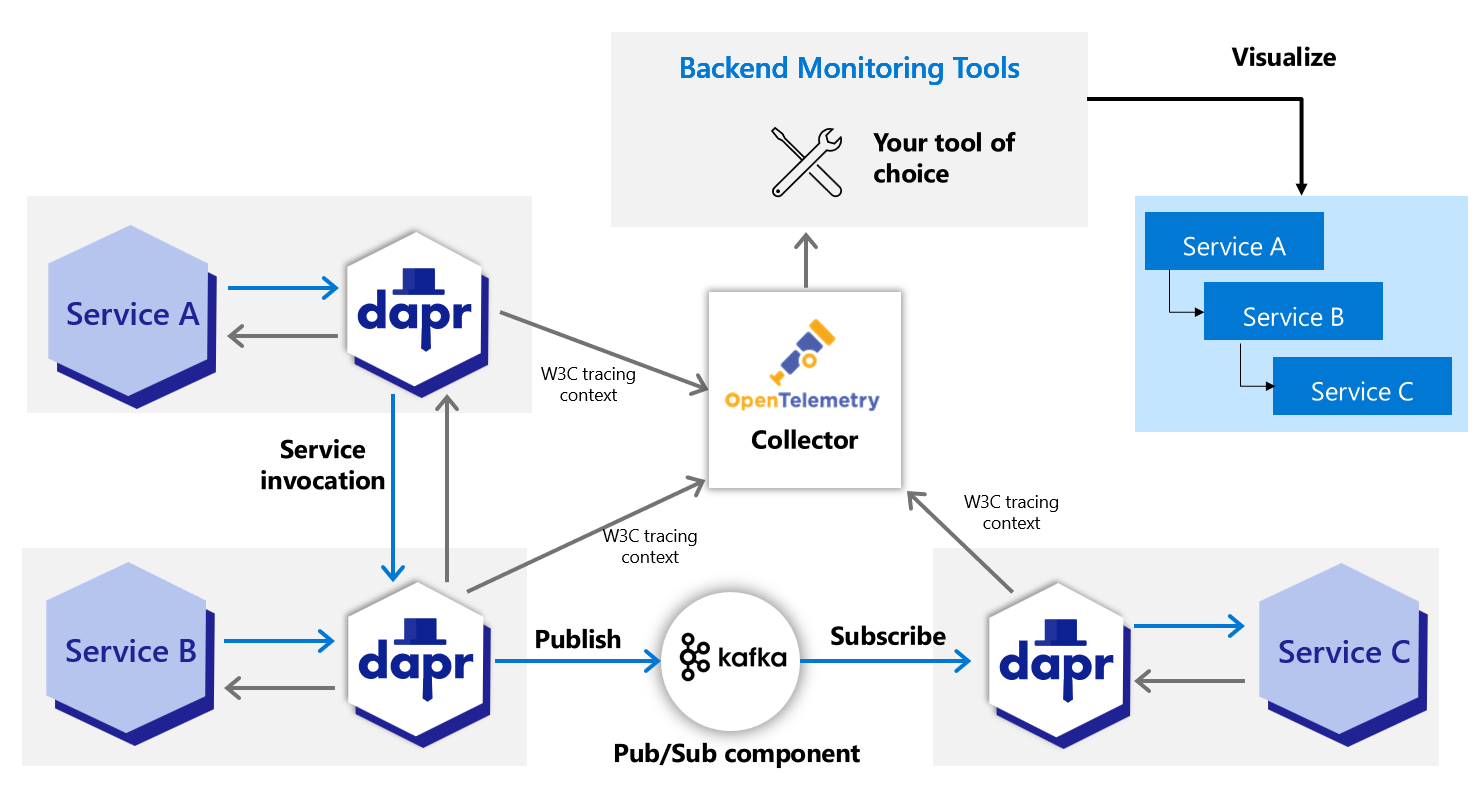
The image below illustrate how DAPR uses OpenTelemetry.
A first demo
To better understand how OTEL works I took the KEDA sample for dotnet and added few changes to instrument the code using the OTEL SDK. The sample uses a console application to publish orders to a ServiceBus queue and a background service to process the queue. Here some key changes:
- enable the trace exporter on the order-generator console app.
- inject the Azure Service Bus message properties to the OpenTelemetry context.
- configure the OpenTelemetry collector pipelines.
- update the DockerCompose to add the otel collector and the observability backends. Make sure the different components are on the same docker network and the containerhostnames are set up consistently.
The code on this GitHub repo implements the following scenario.

First run the “docker compose —profile infra —profile app up -d” to get the infrastructure up and then open the OrderGenerator app to create some orders. Make sure to add the ConsoleExporter to easily inspect to the telemetry sent by the order processor. The logging exporters has been added to the OTEL collector configuration as well to analyze the data sent to downstream backends.
.NET, Azure and OpenTelemetry
In .NET ecosystem, we’re equipped with the OpenTelemetry.NET client, serving as the foundation for instrumenting our solution and to effectively capture telemetry data.
Currently, the Azure Monitor team is working a new library (aka distro) to provide an easier pathway to integrate with Azure Monitor. This new distro is built on top of the OpenTelemetry.NET and integrates with Azure backends via OLTP. Announcement and more details here.
Lastly, we have the Azure Exporter that also enables the integration with Azure Monitor using the Microsoft vendor-specific format.
When to use what, how they fit together and whether there will be a Microsoft contribution in the OTEL collector are all aspects that remains on my agenda to further investigation.
Conclusion
OpenTelemetry is an open standard for all the telemetry signals that allows you to instrument your application once and ingest anywhere. The adoption of OpenTelemetry is experiencing rapid growth making its benefits accessible to everyone. Looking forward to seeing how the project will evolve and how Azure Monitor team will fully embrace it in the coming months.
Photo by Silvan Arnet on Unsplash